Google Analytics is one of the best free tools that provides a vast amount of information regarding your website’s pages.
How to Find Your Top Content
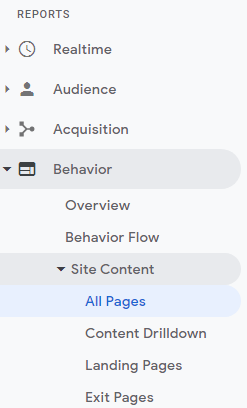
There are many ways to determine what content on your website is bringing in the highest-quality traffic. In Google Analytics, navigate to the Behavior section in the left menu and select “Site Content > All Pages.”

Here you can view each page’s statistics side-by-side in a data table. See below for an example of this table:

This makes it possible to quickly compare and determine which pages are performing the best and which have more room for improvement. Some of the statistics that I find the most helpful in measuring a page’s quality:
- Average Time on Page – The average amount of time users spent viewing a specific page or screen, or a set of pages or screens.
- Pageviews – pageviews is the total number of times a page was viewed. (Repeated views of a single page are counted)
- Unique Pageviews – The number of sessions during which the specified page was viewed at least once. A unique pageview is counted for each page URL + page Title combination.
- Bounce Rate – The percentage of single-page sessions in which there was no interaction with the page. A bounced session has a duration of 0 seconds.
Why What Your Users are Reading Matters
Looking at each metric listed above, you may ask, what does it mean for your business? What does each metric indicate about the content it is referencing?
Average time on page – This metric can help identify pages or posts on which users linger. While you can’t tell for certain what someone is doing on that page for the duration of time, you can infer, to some degree, that a person who spends more active time on a page is most likely interested in that page’s content.
The opposite is also true—pages with a very low average time on page may indicate content that needs some adjustments in order to hold a user’s attention. With this information, you can compare the pages and type of content to see if there’s a pattern.
For example, if pages with more images and well-organized text broken up into easy-to-read sections is registering a much higher average time on page statistic when compared to a page with no images and a single large block of text, try reorganizing and adding a few new pictures and some headlines to break up different topics within the text.
Pageviews – A high number of pageviews can indicate a page is popular, but don’t analyze this information in isolation. Pages with a high amount of views may also have a higher bounce rate, so while the views indicate a popular page, a high bounce rate suggests the opposite.
Bounce Rate – Bounce rate is another great way to measure engagement and interaction with your webpages. A high bounce rate may indicate that the user did not find the content they wanted or expected from their search query.
Example: A user searches for women’s running shoes and because your page targets the words “running shoes” your page for men’s running shoes shows up in the search results. The user in this scenario may click on your website’s ad or search entry thinking it matches their women’s running shoes search. However, when they arrive on the page, the user discovers it is actually a page displaying men’s running shoes. Once the user realizes these are not the types of shoes they are looking for, they will likely exit the page without clicking on anything. Thus, their session will register a bounce from your women’s running shoes page.
Ways You Can Support or Reuse Content
Now you know what your top content is, how can you use this information to help continue the growth of your business? Here are a few ideas:
- Turn it into a LinkedIn article
- Turn numerical data into a graph or infographic for social media
- Develop webinars on the topics featured in top content
- Develop a white paper or case study on the topics
There is a wealth of data within Google Analytics and Search Console, but data is only helpful when you know what it means in practical terms. If you would like more personalized guidance or someone who can help interpret the data for you, contact aJuxt today!
Written by TinaKay Oliver || Google Analytics & SEO Consultant

